Market is a living being and like all living beings it wants to be understood. To be understood it has to be able to communicate. Market, sadly, cannot call you or message you. How does then market speak to you? It does. It does through PRICE. The only signal with market to communicate with others is Price. That is why it is the pivotal piece of market activities.
Polyplex Corporation MCap ₹3750Cr. CMP ₹1195 Tradable Float MCap ₹1456 Cr
Polyplex Corporation is a multinational company headquartered in India, primarily manufacturing biaxially oriented polyester (BOPET) and other plastic films like BOPP, CPP, and Blown PP/PE. They focus on packaging, electrical, and industrial applications, with operations in countries like India, Thailand, Turkey, the USA, and Indonesia, serving over 2600 customers in more than 85 countries.
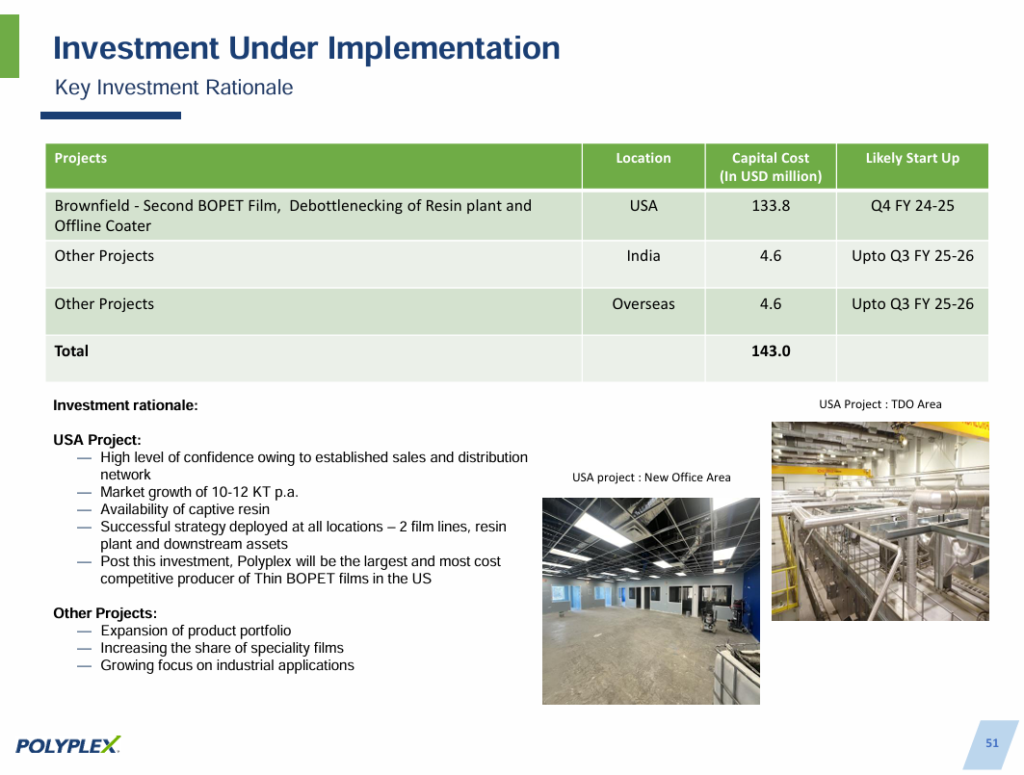
ROCE went from -1% in FY14 to 20% in FY22. Now back to 2% in FY24. Despite such wild return ratios Operating cashflows has not gone negative in last 10 years. On 3049 cr fixed assets they are having 791 cr current work in progress also known as capex with reserves at highest ever and debt lower than FY22 in Sep’24.
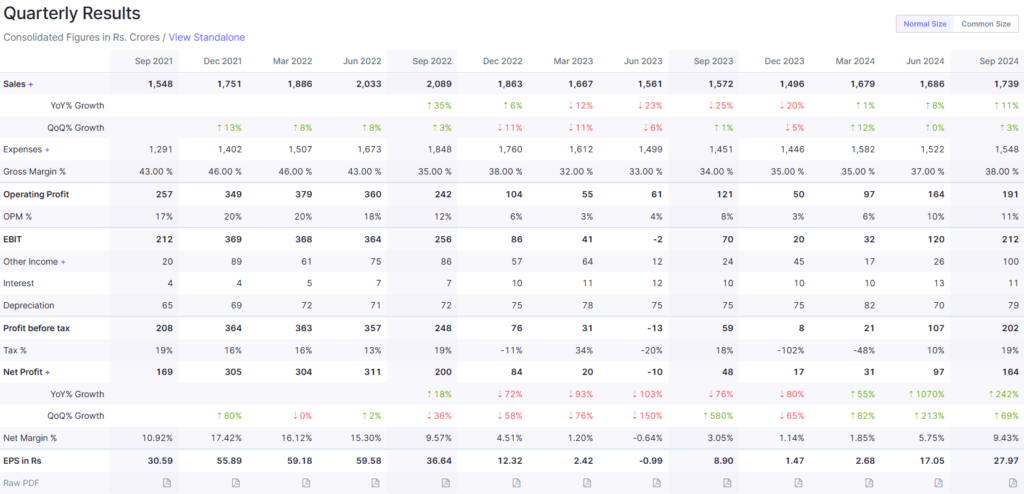
EBITDA margins/OPM in screener went from 3% to 20-25% and in Sep’23 it was again 3% while in recently declared Sep’24 it has risen to 11% with 11% growth in sales leading to big 242% jump in PAT/EPS.
It should be obvious with these jumping up and down margins and return ratios that business is cyclical with commodity nature where the seller does not have much pricing power. In such business, all you can do is to not make the balance sheet bad enough that you do not survive the down cycle. That is for promoter. You as investor would like to enter when things look bleak from sales, margin, profit and return ratios perspective where stock has been beaten for months, and no one is looking at it. But you can hold such business forever hence you would want to sell out when how this commodity business has changed and this time it is different tune is sung by everyone with upbeat margins and rising sales leading to big jump in return ratios and stock trading at new all time highs. This is true for Polyplex and its peers such as Cosmo First, Jindal Poly and so on.
Surprisingly, it peaked in April 2022 at 17 PE at 2870 per share while currently at 1195 with another 140% up move required to reach there it is at 24 PE. Lesson is do not get fooled by current earnings and rather think 12-18 months out. Cyclical/commodities are bought when they look expensive (optically) and are sold when they look cheap (optically). Every time they look cheap a downturn in business is coming. Every time they look expensive an upturn in business is coming.
In such business for valuations, you should look for sales multiple and book multiple. This one trades at 1x book and 0.57x sales while at peak in April 2022 it was at 2.8x book and 1.4x sales. A man with the hammer sees everything as nail to be hit. But that is not the mistake of the hammer. It is lifeless tool and act as you a living being want. Do not use wrong tool and scream that this tool is scam and does not work. Debt to equity here is at 0.24 which is very manageable for them.
If you study this sector, then Cosmo First and Polyplex look better.
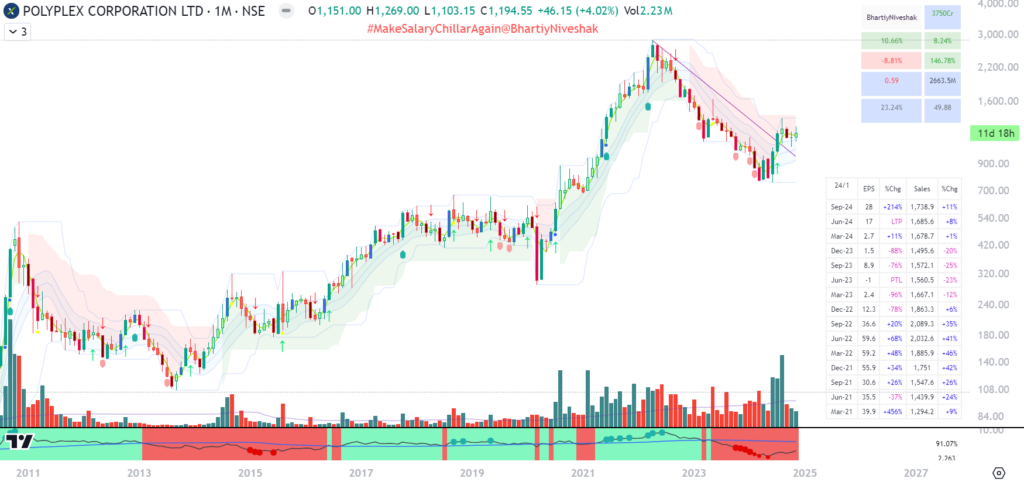
You can see stock did exceedingly well after Covid lows with multiyear breakout making 4.5x from breakout levels in July 2020 before peaking in April 2022 at 2870. Since April 2022 it has corrected by 73% to 761 by March 2024 and now started to bounce.
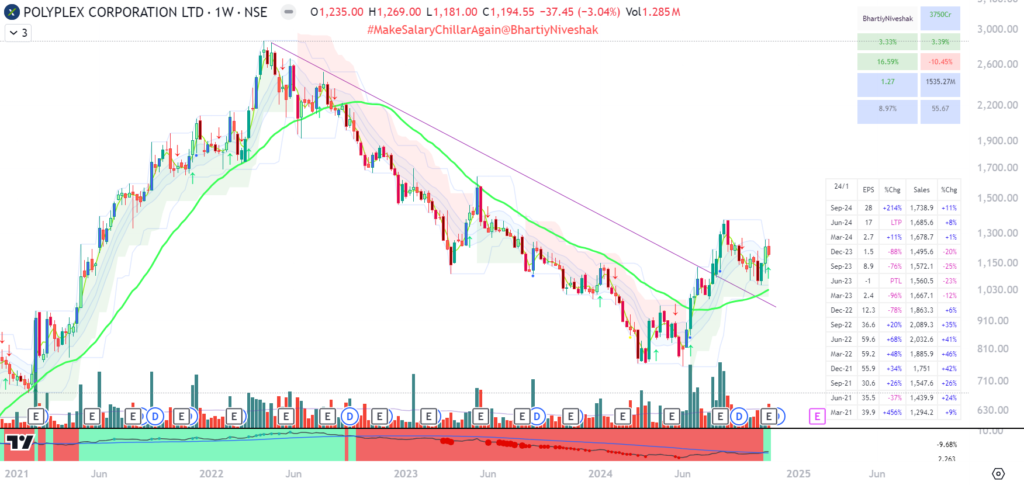
You can see in weekly stock went below GL in August 2022 with NOUS red at 2150 and saw big sell off till 761. In between it bounced but NOUS remained red while GL acted as resistance for it.
First time since April 2022 peak it has crossed GL in Jun 2024 and made swing high of 1375 in Aug 2024 and then went into small consolidation. Also, notice the slope of GL is now upwards.
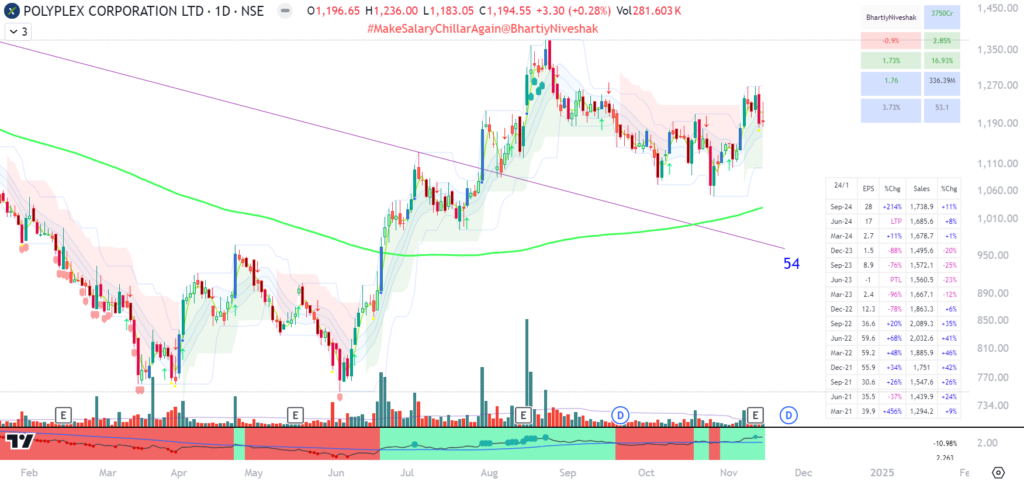
Daily has NOUS green with a green dot signalling massive build-up of smart money in stock positioning for outperformance. NOUS is green in daily and weekly while red in monthly giving it 3/6 score. RSS is at 54 which should improve over the weeks rapidly. Around 1170 it looks good and then pyramid above 1270 and 1375. Three tranches to think. You can play around this as per your style we are sharing as per our understanding.
Kirloskar Brothers MCap ₹16192Cr. CMP ₹2039 Tradable Float MCap ₹3045Cr
Kirloskar Brothers Ltd (KBL) is a leading fluid management solutions provider, primarily known for manufacturing pumps, valves, and hydro turbines. Based in India, KBL has a significant presence globally with operations in countries like the UK, USA, and Thailand. They serve a variety of sectors including water supply, power, agriculture, and industrial applications, focusing on engineering excellence and sustainability.
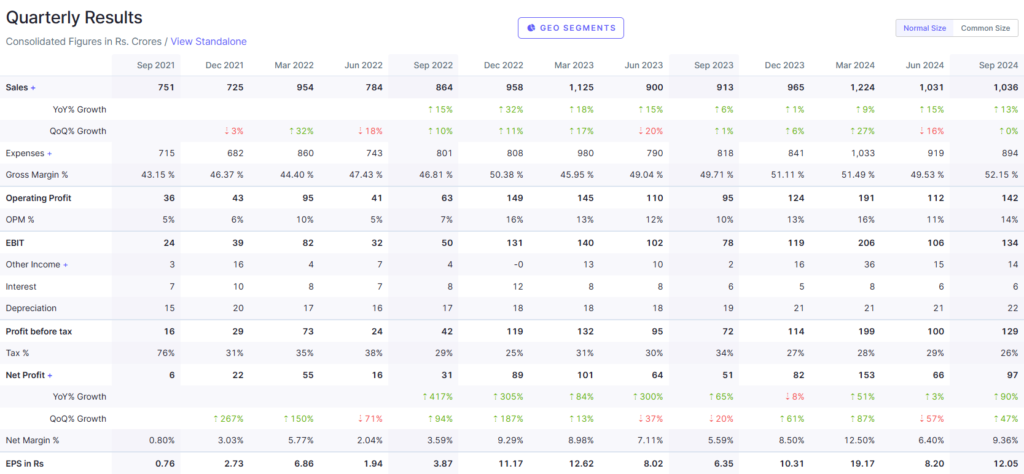
Company has done big deleveraging with lowest debt in last more than 10 years with reserves at highest ever and ROCE above 25%. You ideally want to buy such business when at low margin and return ratios but a technical trade can be taken wherever risk reward is decent with good probability.
https://twitter.com/BhartiyNiveshak/status/1851806766021132784
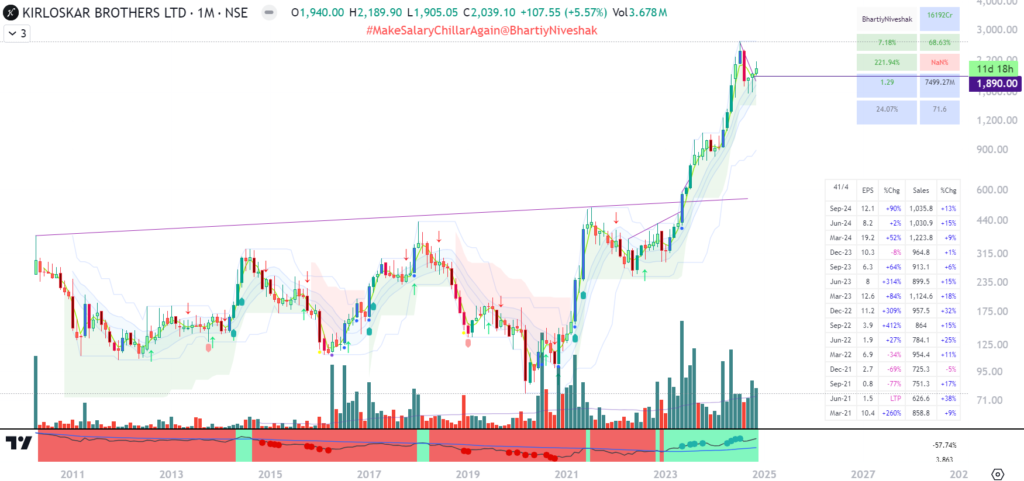
This for your learning purposes and we will not say a word on monthly.
Weekly is good with NOUS green and stock bouncing from GL.
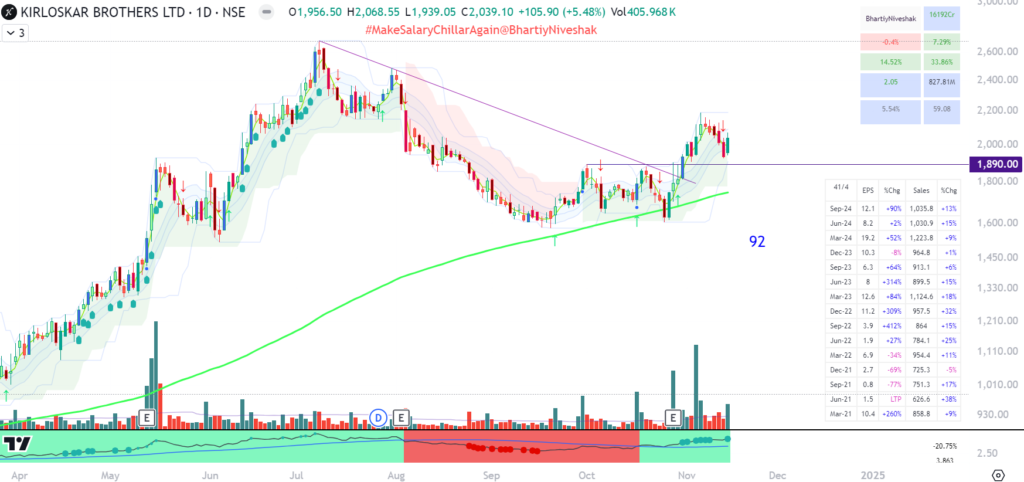
☑️Bounced from sloping upwards GL
☑️RSS at 92
☑️SBD printed a month ago
☑️Good result posted
☑️Market reacted positively to result
✅30%+ move required to make new ATH
NOUS is 6/6 since green in daily, weekly and monthly.
Signpost India MCap ₹1394Cr CMP ₹261 Tradable Float MCap ₹357Cr
Signpost is a digital marketing company that specializes in providing customer engagement and communication solutions for small and medium-sized businesses. Their services include:
- Automated Marketing: Tools for sending personalized text messages, emails, and voicemails to customers.
- Customer Interaction: Enhancing customer engagement through automated reminders, feedback requests, and promotions.
- Reputation Management: Helping businesses manage online reviews and enhance their digital presence.
Signpost’s platform aims to increase customer loyalty, drive repeat business, and improve overall customer satisfaction, primarily targeting local service businesses like home services, automotive, and health & wellness sectors.
In the context of Signpost:
- Merger with Pressman Advertising: Signpost India, a digital out-of-home (DOOH) and advertising technology company, merged with Pressman Advertising, a traditional advertising agency.
- Objective: The merger aimed to combine expertise, resources, and client bases to offer a broader range of advertising and promotional services with a strong emphasis on digital and emerging technologies.
- Outcome: The merged entity focuses on streamlining operations, achieving cost efficiencies, and accelerating business growth.
- Share Exchange: As per the merger agreement, shareholders of Pressman Advertising received one share of Signpost India for each share they held in Pressman, effectively integrating the shareholder bases.
- Market Response: The merger was approved by shareholders, and the new entity has embarked on a path to leverage digital advertising capabilities, particularly in the DOOH space, to enhance market presence and service offerings.
This corporate action was intended to create a more robust entity in the advertising sector, capable of competing effectively in both traditional and digital advertising markets.
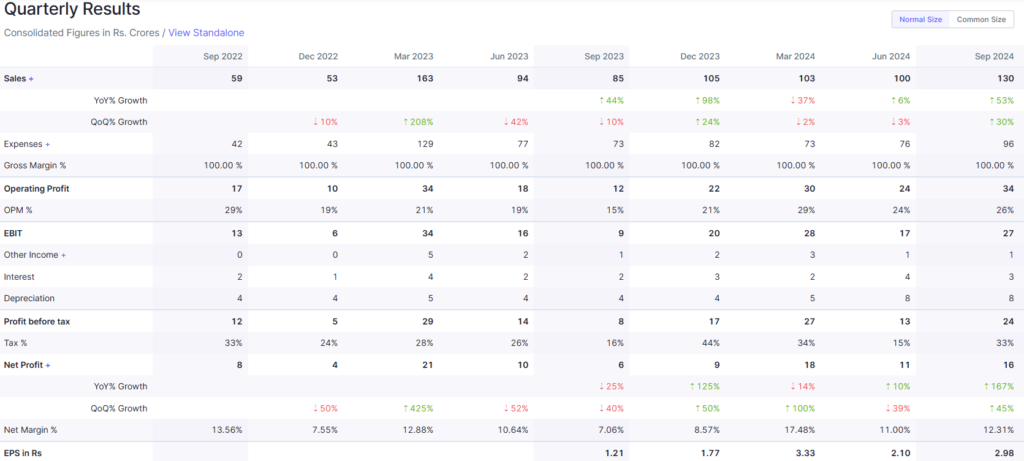
High sales growth of 53% in Sep 2024 YoY with 167% growth in PAT/EPS.
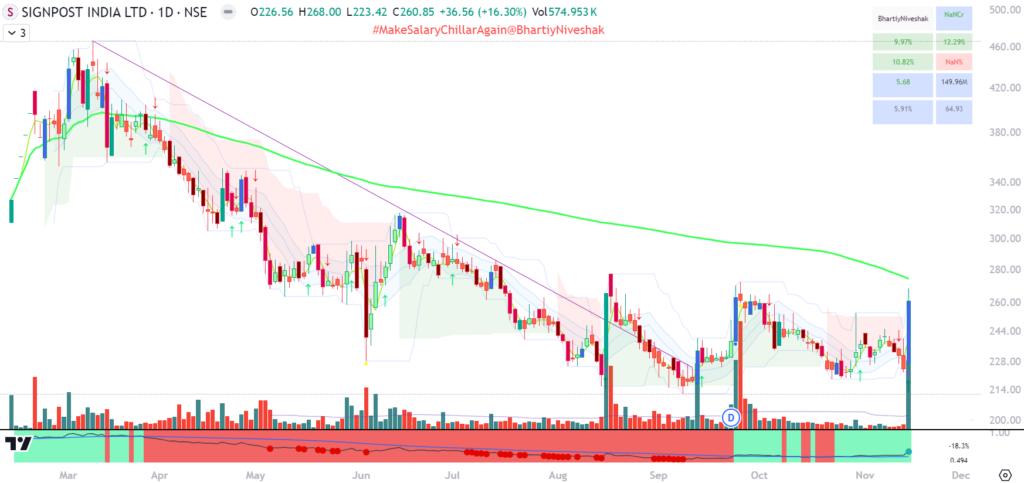
After merger and listing of Signpost shares it hit few upper circuit only to start the big downmove. High of 466 in March 2024 and low of 212 in Sep 2024.
Stock hit 20% UC on 16 August 2024 printing SVD but then again corrected making a new low. A SBD was printed on 12 Sep and next one on 24 Sep signalling smart money getting in the stock for coming up move. On 14 Nov another SVD showed up while stock was up 16%.
2 SVDs and 2 SBDs after fall of more than 50% signals smart money piling on this stock.
Stock looks good on any dip or here. Pyramid opportunities will come as it crosses GL and then as it crosses the swing high above GL making new high. Shared this name on Friday in Telegram for study.
NOUS you can see is lush green with green dot despite price near bottom only. Since listing history is short no point discussing other time frames such as weekly or monthly.
You can also study CCL Products and Siyaram Silks.
Hope these ideas for your study will help you. Use these ways of thinking to get better understanding and use them in future in other stocks. Focus on structural tendencies of the market and keep succeeding.
Thank you for supporting BN Parivar and being such a great member of bhartiyniveshak.com. Lots of you write interesting messages regularly in Pumble/Telegram/X/YouTube and BN tries to respond to most of you. It’s a great connection and it keeps motivation high to put out interesting content that can help you become a good trader & investor.
We hope the content is useful and has helped you.
We want to reach out to as many people as possible and help them understand the power of FunTec approach in making investing & trading decisions. We need your help. You can gift a subscription to your friend, family member or refer this blog to them.
We need your help in growing this and any support would be appreciated. Thank you & Happy Markets!
Disclaimer: Posts on the platforms of BN are our perspective on the market. These are purely meant for learning purposes. The perspective provided should not be construed as investment advice or solicitation to trade. We may have positions in the stock mentioned. You agree to make no trade relying on the above contained information fully or partly. By using the content, you agree to these T&Cs.

@bharatiyNiveshak Your price action, technical, and cyclic analysis on stocks are incredibly insightful! They help investors avoid common pitfalls, like buying when it’s time to sell & selling when it’s time to buy. Keep sharing your expertise! We love ur blog
Great. Keep learning.