There are many ways to do the same thing, but you want to optimize for the output controlling the efforts that go in. There Market Pulse scores well and is something worth putting the effort into.
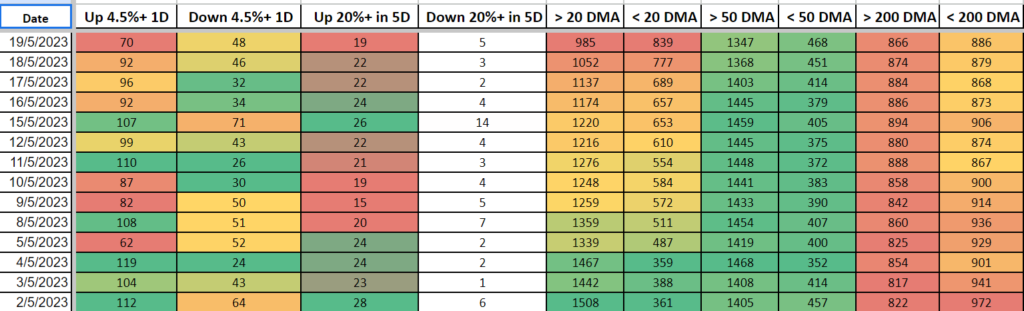
As you can see it has daily data for certain types of points such as number of stocks up more than 4.5%, similarly down more than 4.5% for the day, 20% or more mover in last five days and then comes data revolving around MAs. Stocks trading above 20 DMA, 50 DMA and 200 DMA and similarly for other side of these MAs.
Market Pulse: Market averages like Nifty 50 and others do not tell you much about how the market is doing. In all likelihood you have stocks that are not part of Nifty 50. Even if they were you may see red in portfolio while Nifty 50 is green due to weight issues.
That is where Market Pulse enters the fray.
Data Points for Bullish Swing:
?4.5%+: You want this column to have increasing values.
?-4.5%+: You want this column to have decreasing values.
?20%+ in 5D: You want this column to have increasing values.
?-20%+ in 5D: You want this column to have decreasing values.
?20 DMA: You want more stocks crossing DMA 20 than going below it.
?50 DMA: You want more stocks crossing DMA 50 than going below it.
?200 DMA: You want more stocks crossing DMA 200 than going below it.
For someone trying to figure out the local tops and bottoms in the market, 4.5% mover columns are important as they change first and fast leading to change in 20% in 5D data point.
For short term swing players, 20 DMA columns are most important.
Positional players should focus more on 50 DMA and for bull run 200 DMA, plays the major role.
Every spike in 20 DMA will lead to some run-in market but that may not be a good space for positional pickings or bull run.
Every bull run that starts and makes great money will start with spike in 4.5%+ column leading to ripple effects in 20% in 5 days and stocks above 20 DMA number increasing sustainably over the days. But not every spike 4.5%+ column spike will lead to bull run. The relation between 4.5%+ column and bull is many to one.
This tool is accessible to all of you which we hope to update weekly and if important enough then during the week as well. Bookmark the link and start using it to better the deployment of capital. Happy Investing.
Disclaimer: Posts on the platforms of BN are our perspective on the market. These are purely meant for learning purposes. The perspective provided should not be construed as investment advice or solicitation to trade. We may have positions in the stock mentioned. You agree to make no trade relying on the above contained information fully or partly. By using the content, you agree to these T&Cs.