The biggest winners often don’t look extraordinary at the start — they look familiar. Same industry structure, same tailwinds, same capital cycle, and same stock structure with relative strength & urgency. What changes is positioning, timing, and the ability to execute when the cycle turns. By the time something feels obvious, the easy money is gone. The real edge lies in spotting patterns early — when the story is still forming, not when it’s already proven.
RR Kabel MCap ₹20077 Cr | CMP ₹1775 | Float MCap ₹1682 Cr
Incorporated in 1995, RR Kabel is into wires & cables and FMEG (10% sales but loss making) including fans, lighting, switches, and appliances. Domestic accounts for 73% of sales while rest 27% is export.
RR Kabel: From $1 Billion Milestone to Potential Re-rating
FY26 was a breakout year.
Revenue grew 27.6% YoY to ₹9,722 crore.
EBITDA rose 61.8% to ₹789 crore.
PAT increased 58% to ₹492 crore.
Core Wires & Cables (≈90% of revenue) led the performance—up 31% YoY to ₹8,764 crore.
Q4 sustained momentum despite seasonality:
Revenue +33.7%, EBITDA +34.6%, PAT +30.1%.
FMEG is still loss-making, but losses narrowed. Breakeven is guided for FY27, led by distribution expansion and new categories.
Dividend remains healthy. Total FY26 payout stands at ₹9.5 per share around 22% of EPS —real cash return alongside growth.
Execution: Where the Story Is Changing
The key shift is execution.
Under its FY25–28 plan, management is targeting:
18% CAGR in W&C
25% CAGR in FMEG
~2.5x EBITDA growth
Near-term, FY27 W&C volume growth is guided at 16–18%. Cables are expected to grow faster than wires—important because cables carry higher margins.
This mix shift is already visible. Margins improved ~130 bps in FY26.
Guidance: ~9.5% EBIT margin in FY27, moving toward double digits by FY28.
What’s driving this:
- Operating leverage kicking in
- Better product mix (more cables, higher voltage)
- Export expansion
- Cost efficiencies
Capex is measured—₹1,200 crore over FY26–28, phased evenly. No lumpiness.
A key upgrade: moving from 66 kV to 220 kV cable capability.
New demand areas like data centres are opening up.
Underlying demand remains strong—housing, infrastructure, industrial capex, and exports.
Valuation: The Gap That’s Closing
Despite better performance than KEI, the stock still trades at a discount.
That gap exists mainly due to margins.
But margins are improving. And that changes the equation.
The company already delivers:
- Stronger cash flow conversion
- Better working capital discipline
- Healthy growth (TTM and 3-year)
As margins catch up, valuation usually follows.
The re-rating can happen in multiple ways—price catching up, peers cooling off, or both.
This is no longer just a growth story.
It is moving toward:
Growth + margin expansion + capital efficiency
Balance sheet is clean. Cash flows are strong. Capacity is being added with discipline.
The sector tailwinds are intact—electrification, real estate, infra, renewables, and now data centres.
Risks remain: commodity volatility, competition, export uncertainties.
But execution is improving, and that’s what matters most.
Finolex Cables at 2.6, KEI at 4.1 while Polycab is at 4.65 PS. RR trades at 2.1 PS.
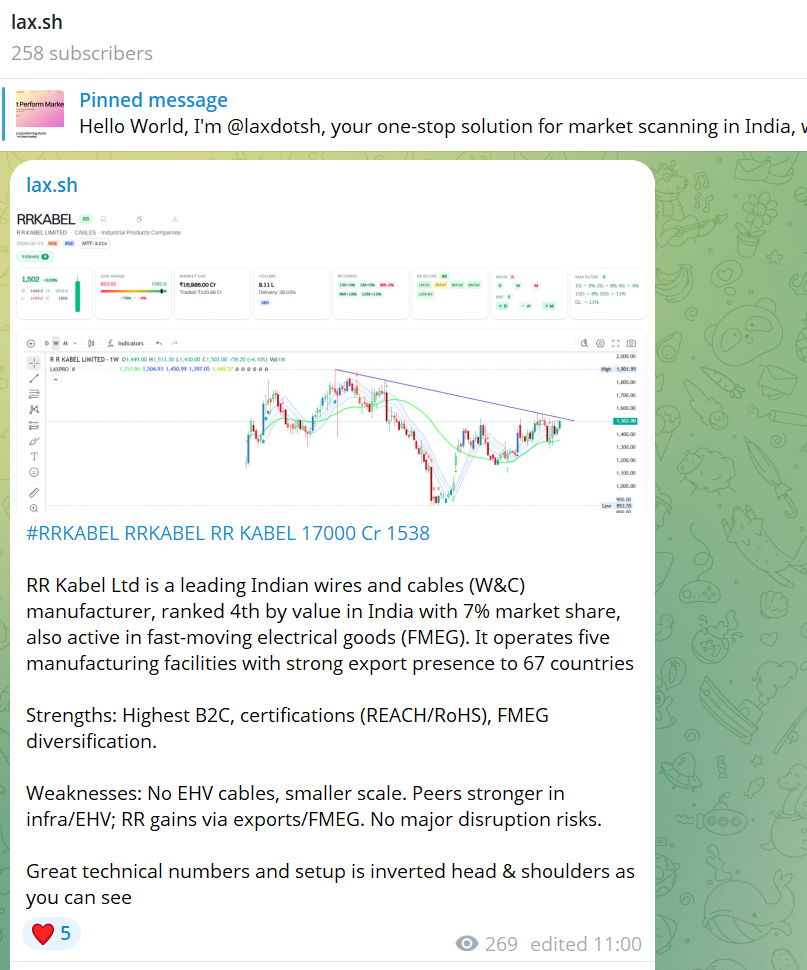
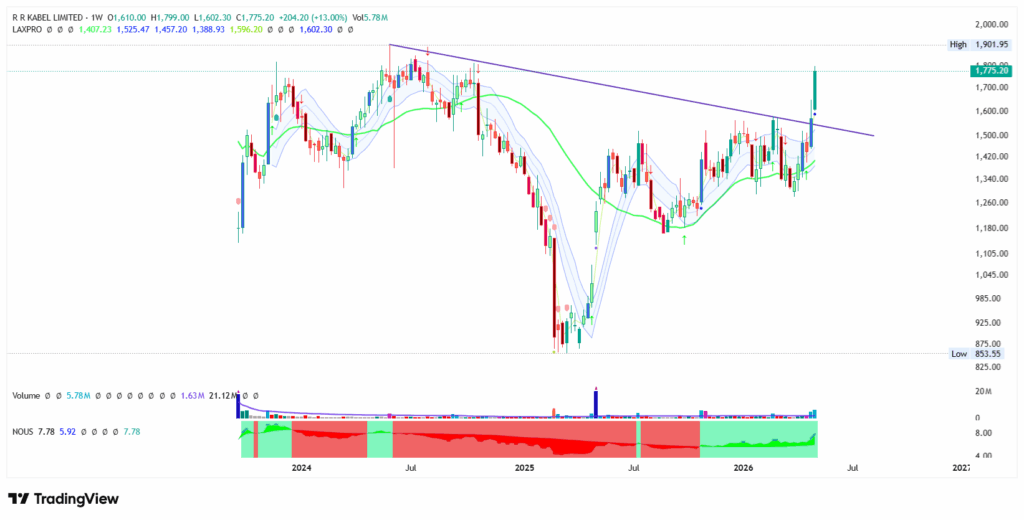
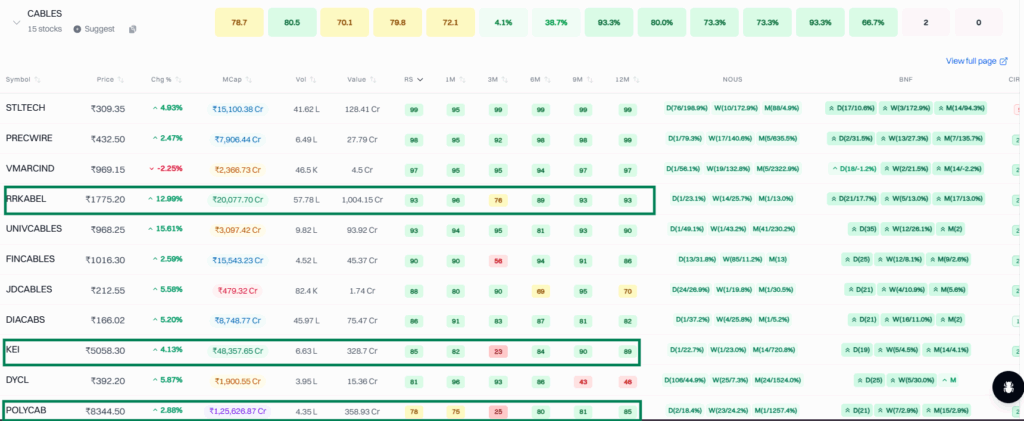
Good inverted head & shoulders and breakout even though trading below ATH. RS score table below suggests leadership is shifting—not Polycab, not KEI, but RR Kabel. No discussion of NOUS & BNF because both are good.
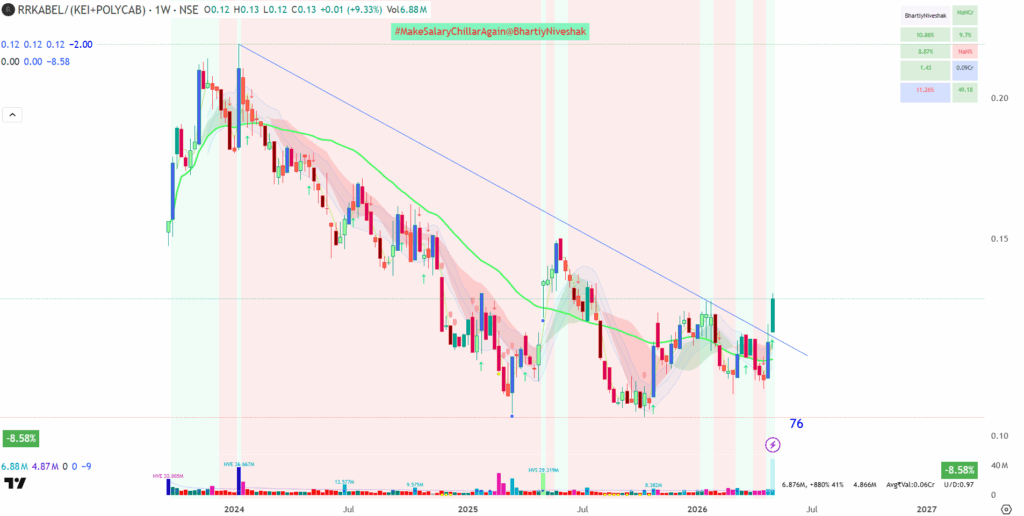
As elite fund manager if you don’t own an AI/data center proxy like wires & cables, beating benchmarks gets harder. Even within the sector, underweighting emerging leaders like RR Kabel vs established names can create relative underperformance. At scale, this becomes a math problem—if A/B is rising, you need A on your side to outperform. That is just mathematical reality as seen from ratio chart. That is how maths work.
Free float is limited (~7.3%). Promoters hold 61.65%, FIIs 9.1%, DIIs 13.33%, and over 8% is concentrated with 1%+ public holders.
As company proves its mettle with timely capex, better product mix with higher margins, scaling FMEG faster and turning profitable from loss making with branding and other efficiencies more and more suitors will come for ever reducing float. What will happen then? Should you wait for the confirmation on numbers?
This sits in an AI proxy segment growing faster than India and gaining share vs larger peers, with improving margins driving stronger earnings growth. Do your own research and build conviction as per BN system.
Markets reward transition phases.
From “good growth” to “better economics.”
From “discounted” to “re-rated.”
This story is entering that zone.
Not obvious yet. But no longer early either.
Happy Investing.
Thank you for supporting BN Parivar and being such a great member of BhartiyNiveshak.com.
Many of you regularly write interesting messages in Pumble, Telegram, X, and YouTube, and BN tries to respond to most of you. It’s a great connection, and it keeps motivation high to continue sharing valuable content that can help you become a better trader and investor.
We hope the content has been useful and has helped you on your investing journey.
We want to reach as many people as possible and help them understand the power of the FunTec approach in making investing and trading decisions. You can gift a subscription to a friend or family member, or refer this blog to them.
We need your help in growing this community, and any support would be greatly appreciated.
Thank you, and Happy Markets!
Disclaimer: Posts on the platforms of BN are our perspective on the market. These are purely meant for learning purposes. The perspective provided should not be construed as investment advice or solicitation to trade. We may have positions in the stock mentioned. You agree to make no trade relying on the above contained information fully or partly. By using the content, you agree to these T&Cs.
Excellent blog breaking down complex concepts into a structured and easy to follow narrative.
It blend theory with practical insights making it useful for both beginners and experience traders.
Thank you BN.
Excellent analysis. So this concept is blueprint for spotting such opportunities in future or you meant something else?
Thanks. Check opening para.
https://www.financialexpress.com/market/stock-insights/the-next-polycab-this-fast-growing-midcap-may-be-near-an-inflection-point/4235656/